
CMG Granulators at PRS India 2025
5 November 2025
CMG Granulators at Plast Eurasia Istanbul 2025
19 November 2025
CMG has produced an initial assessment of its organizational carbon footprint (or GHG inventory) limited to the Budrio plant with the aim of understanding and evaluating its performance in this area for the year 2024 and comparing it with the base year 2019.
The concept of carbon footprint originated within the broader concept of ecological footprint, developed in the 1990s in response to growing awareness of the impact that greenhouse gas emissions have on climate change.
Global warming, the role of CO2 and other greenhouse gases in this phenomenon, and its anthropogenic causes are issues that emerged in the scientific community as early as the beginning of the 20th century, but have only become a concern in the political and civil world in recent decades.
The need to measure and report the greenhouse gas emissions of a product, service, or organization throughout its entire life cycle is therefore essential in order to implement concrete policies and actions to reduce them, with the aim of limiting the damage caused by climate change, which is having an increasingly strong and widespread impact.
The primary objective of the Organization Carbon Footprint (OCF) study is to quantify the potential impact of the organization's activities on global warming. Specifically, the OCF is a measure of the direct and indirect greenhouse gas (GHG) emissions produced by the organization's activities.
The results of the Carbon Footprint are expressed in CO2 equivalent (CO2eq), an environmental indicator that expresses and encompasses all greenhouse gas emissions emitted directly or indirectly by the organization.
Emissions calculated in the study
Scope 1: Direct emissions from activities owned or controlled by the organization that release emissions into the atmosphere.
Scope 1 may include:
-
- Direct emissions from stationary combustion: fossil fuels or biomass burned in fixed equipment (e.g., boilers)
- Direct emissions from mobile combustion: fuel used in transportation (e.g., company fleet vehicles)
- Process emissions: arising from industrial processes (e.g., N₂O)
- Fugitive emissions: unintentional release of greenhouse gases (e.g., refrigeration systems)
- Emissions and removals from land use and forestry
Scope 2: Indirect emissions released into the atmosphere associated with the consumption of purchased electricity, heat, steam, and cooling.
Scope 2 emissions can be estimated using two different approaches:
- Market-based: reflects greenhouse gas emissions based on any specific contracts the organization has with its electricity supplier, allowing the characteristics of the energy actually purchased to be taken into account. In the absence of specific contracts, they will reflect the greenhouse gas emissions of untracked grid electricity (residual mix*)
- Location-based: uses the average emission factor for energy produced in the country where the plant operates, regardless of the supplier selection. In this study, greater emphasis is placed on the market-based approach as it potentially highlights the company's future strategic choices. The results calculated according to the location-based approach will also be reported for comparison.
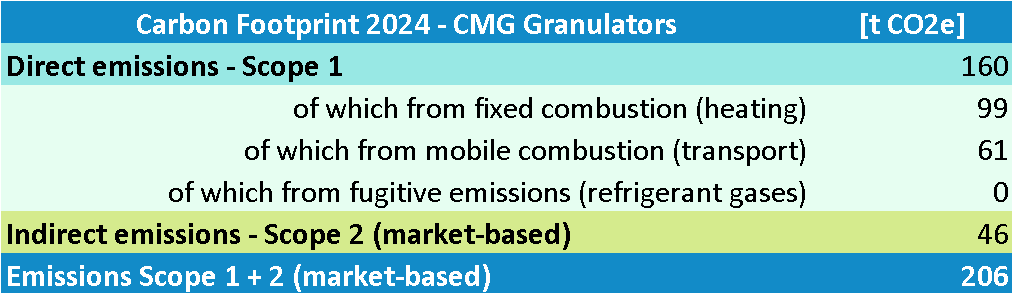
Results - GHG emissions associated with CMG
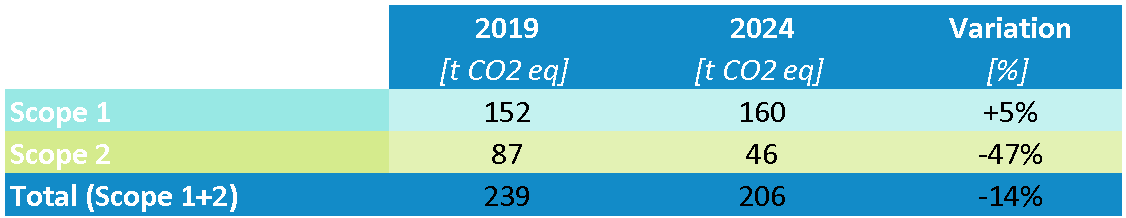
Results - Comparison with reference year
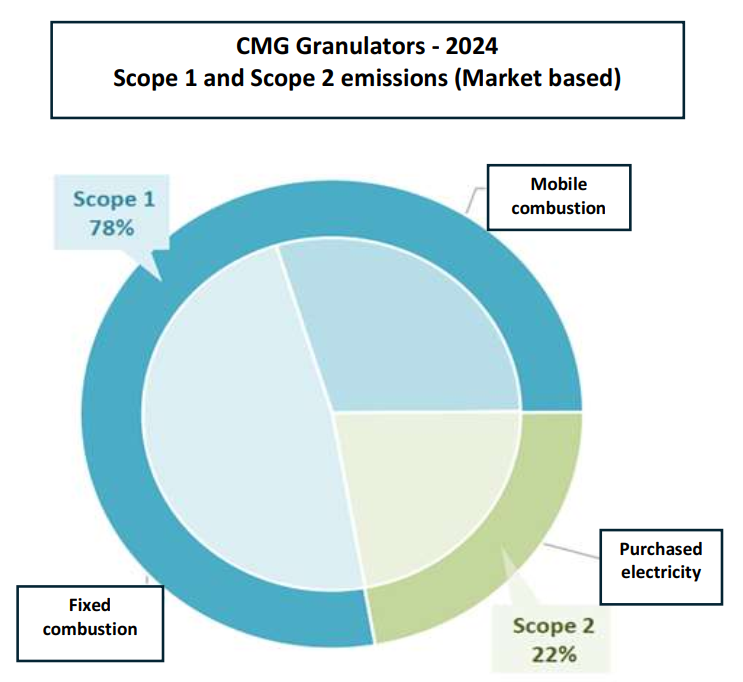
Scope 1 and 2 emissions measured for 2024 amounted to 206 t CO2e (market-based approach), of which 78% was due to Scope 1 emissions related to direct emissions from fixed combustion. Scope 2 emissions contribute 22% of the total carbon footprint, with the main contribution coming from indirect emissions related to the production of the electricity mix consumed by the company.
Comparing the data for the reference year 2024 with those for the base year 2019, there was a significant overall reduction in Scope 1 and Scope 2 emissions of 14%. This result is mainly attributable to the marked decrease in indirect emissions from purchased energy (Scope 2), which fell by 47% compared to 2019.
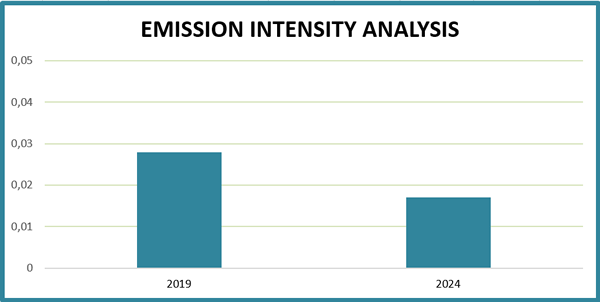
Emission intensity analysis
It is also useful to analyze the emission intensity* in relation to turnover, expressed in tons of CO₂ equivalent per thousand euros (tCO₂eq/k€). The analysis shows a reduction in carbon intensity from 0.028 tCO₂eq/k€ in 2019 to 0.017 tCO₂eq/k€ in 2024, a 40% reduction in emissions intensity.
* It should be noted that this indicator only considers Scope 1 and Scope 2 emissions and, therefore, is not comparable to a Product Carbon Footprint.
Customer Service
With Headquarters, Production Site and Technical Center in Italy, and the largest distribution network in the plastics industry, CMG is active all over the world with localized technical service, spare parts and sales centers. Find the nearest CMG service center at the following link: https://www.gatesproject.cloud/cmg1/en/contacts